
Treasure Valley Home Sales Jump in March, Listings Decline
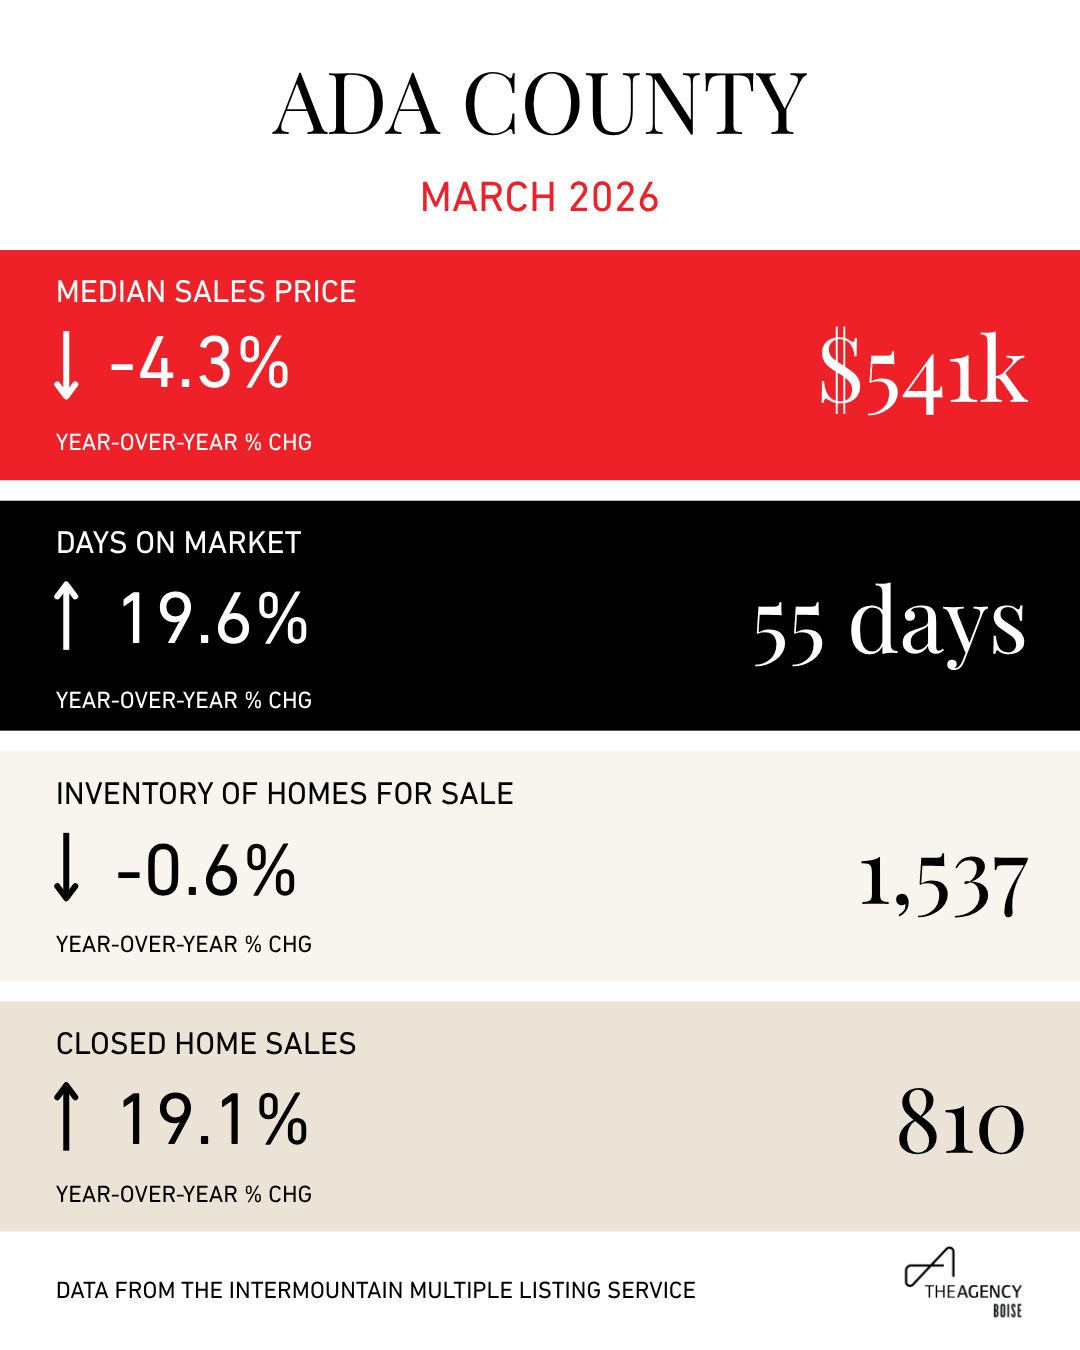
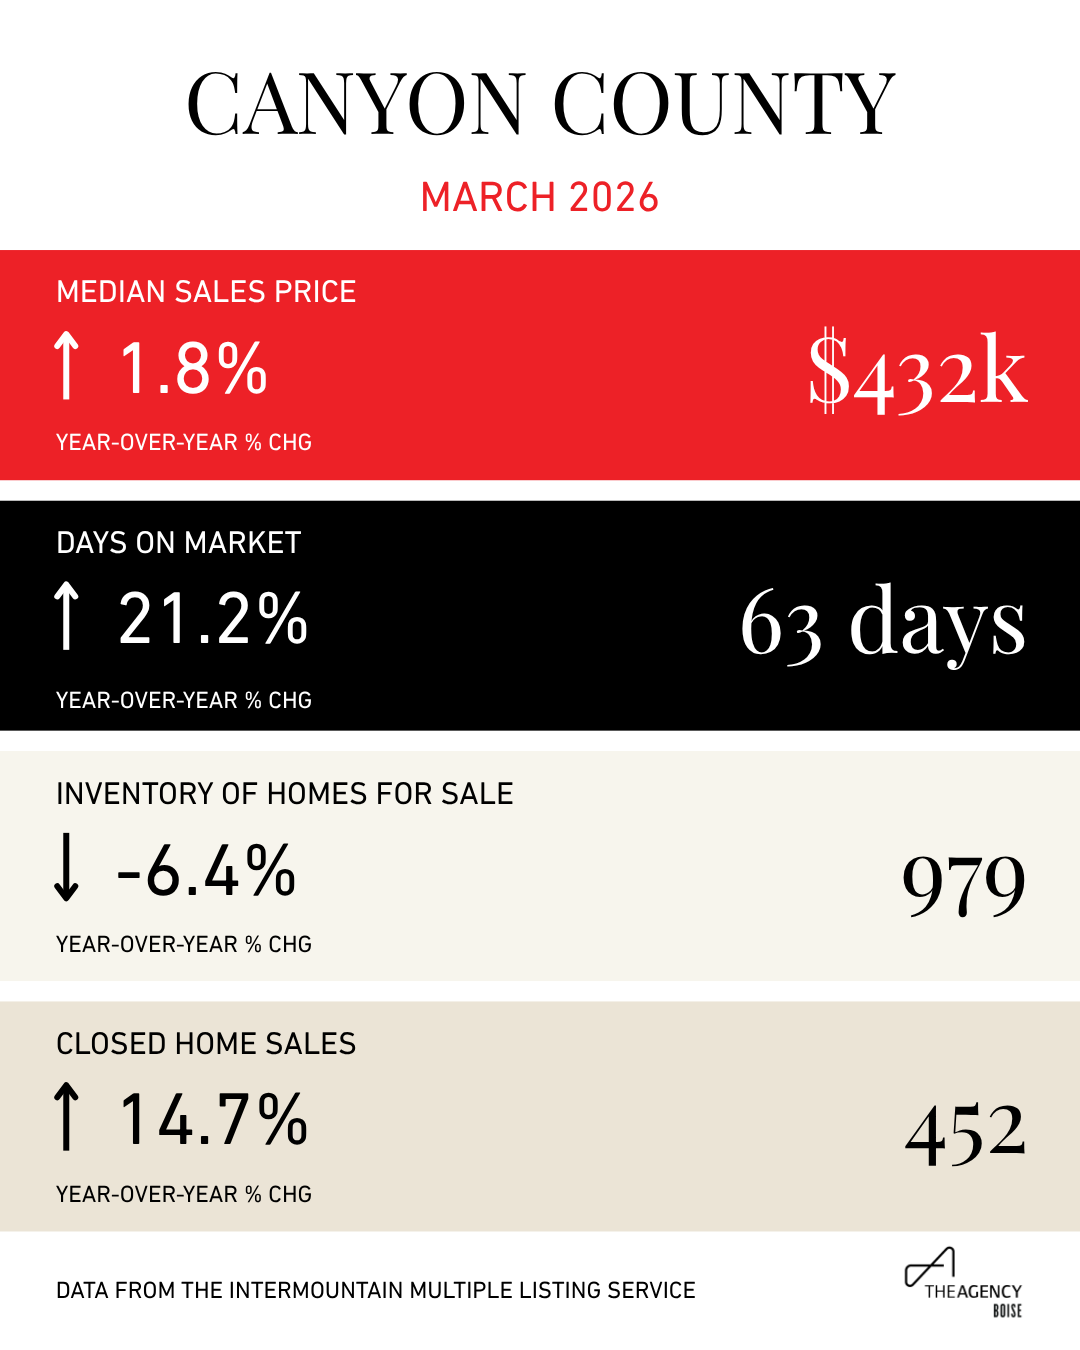
Home sale activity had a strong start in March, with the number of home sales increasing by double-digits when compared to the same month a year ago. There were 810 sales of single-family and single-family homes with acreage in Ada County, nearly 20% more closings than in March 2025. In Canyon County, there were 452 closings last month, a 14.7% year-over-year increase.
Sales were up, but inventory, or the number of available listings, was down compared to last year — a decline of 0.6% in Ada County and 6.4% in Canyon County. While the dip in Ada County inventory may seem small, there hasn’t been a year-over-year decline in inventory in the county since January 2024. In 2024 and 2025, both counties gained traction in accumulating inventory and moving the housing market to a more balanced level.
Months supply of inventory is the metric used to measure the relationship between supply and demand, calculated by dividing the current inventory by the average sales from the last 12 months and indicates how long current inventory would last if no new listings were added. A balanced market, not favoring buyers or sellers, is typically considered 4-6 months of supply.
In Ada County, months supply of inventory was 2.0 months in March, down 7.6% compared to March 2025. Canyon County is slightly more balanced with 2.3 months last month, a 10.2% decrease from a year ago.
The median home sales price dipped year-over-year in Ada County and increased in Canyon County in March. In Ada County, the median sales price for homes that closed last month was $540,945, down $24,055 when compared to March 2025. Canyon County home sales had a median sales price of $432,490, $7,500 more than a year ago.
“Home prices reflect the mix of homes that sold in a particular month, for example lower price point versus higher price points, the share of new home sales compared to existing or resale homes, as well as sellers making price adjustments to meet buyer demand,” said Katie Traughber, real estate professional with The Agency Boise. There has also been a slight softening of home prices due to the cumulative inventory recovery over the past two years.
Interestingly, the median sales price of existing/resale homes in Ada County was higher than new construction homes in March — $555,000 compared to $534,000, respectively. Typically, we see a higher premium for new homes compared to resale. The share of new home sales with a lower median sales price pulled the overall median sales price down for the county last month.
Buyers are also still taking advantage of price reductions and negotiating on price regardless of county and build age. In March, homes sold for an average of 2.0-2.5% less than the original list price. On average, homes are also spending a significant amount of time on the market before going under contract: 55 days in Ada County and 63 days in Canyon County, giving buyers more options and time to see what’s on the market.
However, averages are just that — averages. Traughber explains, “There are still homes that are going under contract in a matter of days and selling at or over list price. Buyers need to be ready to make a move when the right property comes on the market.” Inventory has stalled for the time being, giving sellers a chance for sellers to stand out in the busier spring market. Pricing competitively, preparing the property and marketing strategically makes a significant difference in market times and the proceeds of a sale.
The Agency Boise is made up of a select group of driven agents that have deep roots in the community, local expertise, and are backed with a regional and global reach. Who you work with, matters.


Other notable metrics:
In Ada County,
Buyers had 1,537 available homes to choose from in March — 10 less than in March 2025.
There were 1,390 pending sales, or homes under contract, in March, up 11.3% compared to a year ago.
With 810 sales for the county, there were 130 more closings in March than the same month a year ago.
The median sales price for homes that closed last month was $540,945, down $24,055 when compared to March 2025.
The average percent of the original list price received for homes that closed in March was 97.9%, meaning that on average, buyers paid 2.1% less than the price for which the home was originally listed.
Months supply of inventory was 2.0 months in March, down 7.6% compared to March 2025. Months supply is calculated by dividing the current inventory by the average sales from the last 12 months and indicates how long current inventory would last if no new listings were added. A balanced market, not favoring buyers or sellers, is typically considered 4-6 months of supply.
The most popular price range for home sales was $450,000-$600,000 with 281 sales — approximately a third of all sales for the county. Of those, the average days on market before going under contract was 61 days and the average percent of original list price received was 97.5%.
As of April 16, 2026, the list price range with the most inventory was $450,000-$600,000 with 437 listed homes. Of those, the average days they’ve spent on the market so far is 50 days. Those listed homes have undergone an average of a 1.0% price drop from the original listing price.
In Canyon County,
With 979 active listings in March, inventory was down 6.4% year-over-year, giving buyers 67 fewer listings to choose from compared to a year ago. New homes made up over half of all available homes for sale.
There were 804 pending sales in March 2025, down 3.5% when compared to the same month a year ago.
With 452 sales last month, closings were up 14.7% compared to March 2025.
The median sales price for March home sales was $432,490, $7,500 more than in March 2025.
The average percent of the original list price received for homes that closed in March was 97.2%, meaning that on average, buyers paid 2.8% less than the price for which the home was originally listed.
Months supply of inventory was at 2.3 months in March, down 10.2% from the same month last year. Months supply is calculated by dividing the current inventory by the average sales from the last 12 months and indicates how long current inventory would last if no new listings were added. A balanced market, not favoring buyers or sellers, is typically considered 4-6 months of supply.
The most popular price range for home sales was $300,000-$450,000 with 242 sales, over half of all home sales for the county. Of those, the average days on market before going under contract was 66 days and the average percent of original list price received was 97.0%.
As of April 16, 2026, the list price range with the most inventory was $450,000-$600,000 with 341 listed homes. Of those, the average days they’ve spent on the market so far is 57 days. Those listed homes have undergone an average of a 1.0% price drop from the original listing price.

Ready for more insights?
The Agency Boise provides detailed monthly analysis, interactive reports, and custom market research for our agents.