
Home Sales Rise as Inventory Tightens Across Ada and Canyon Counties
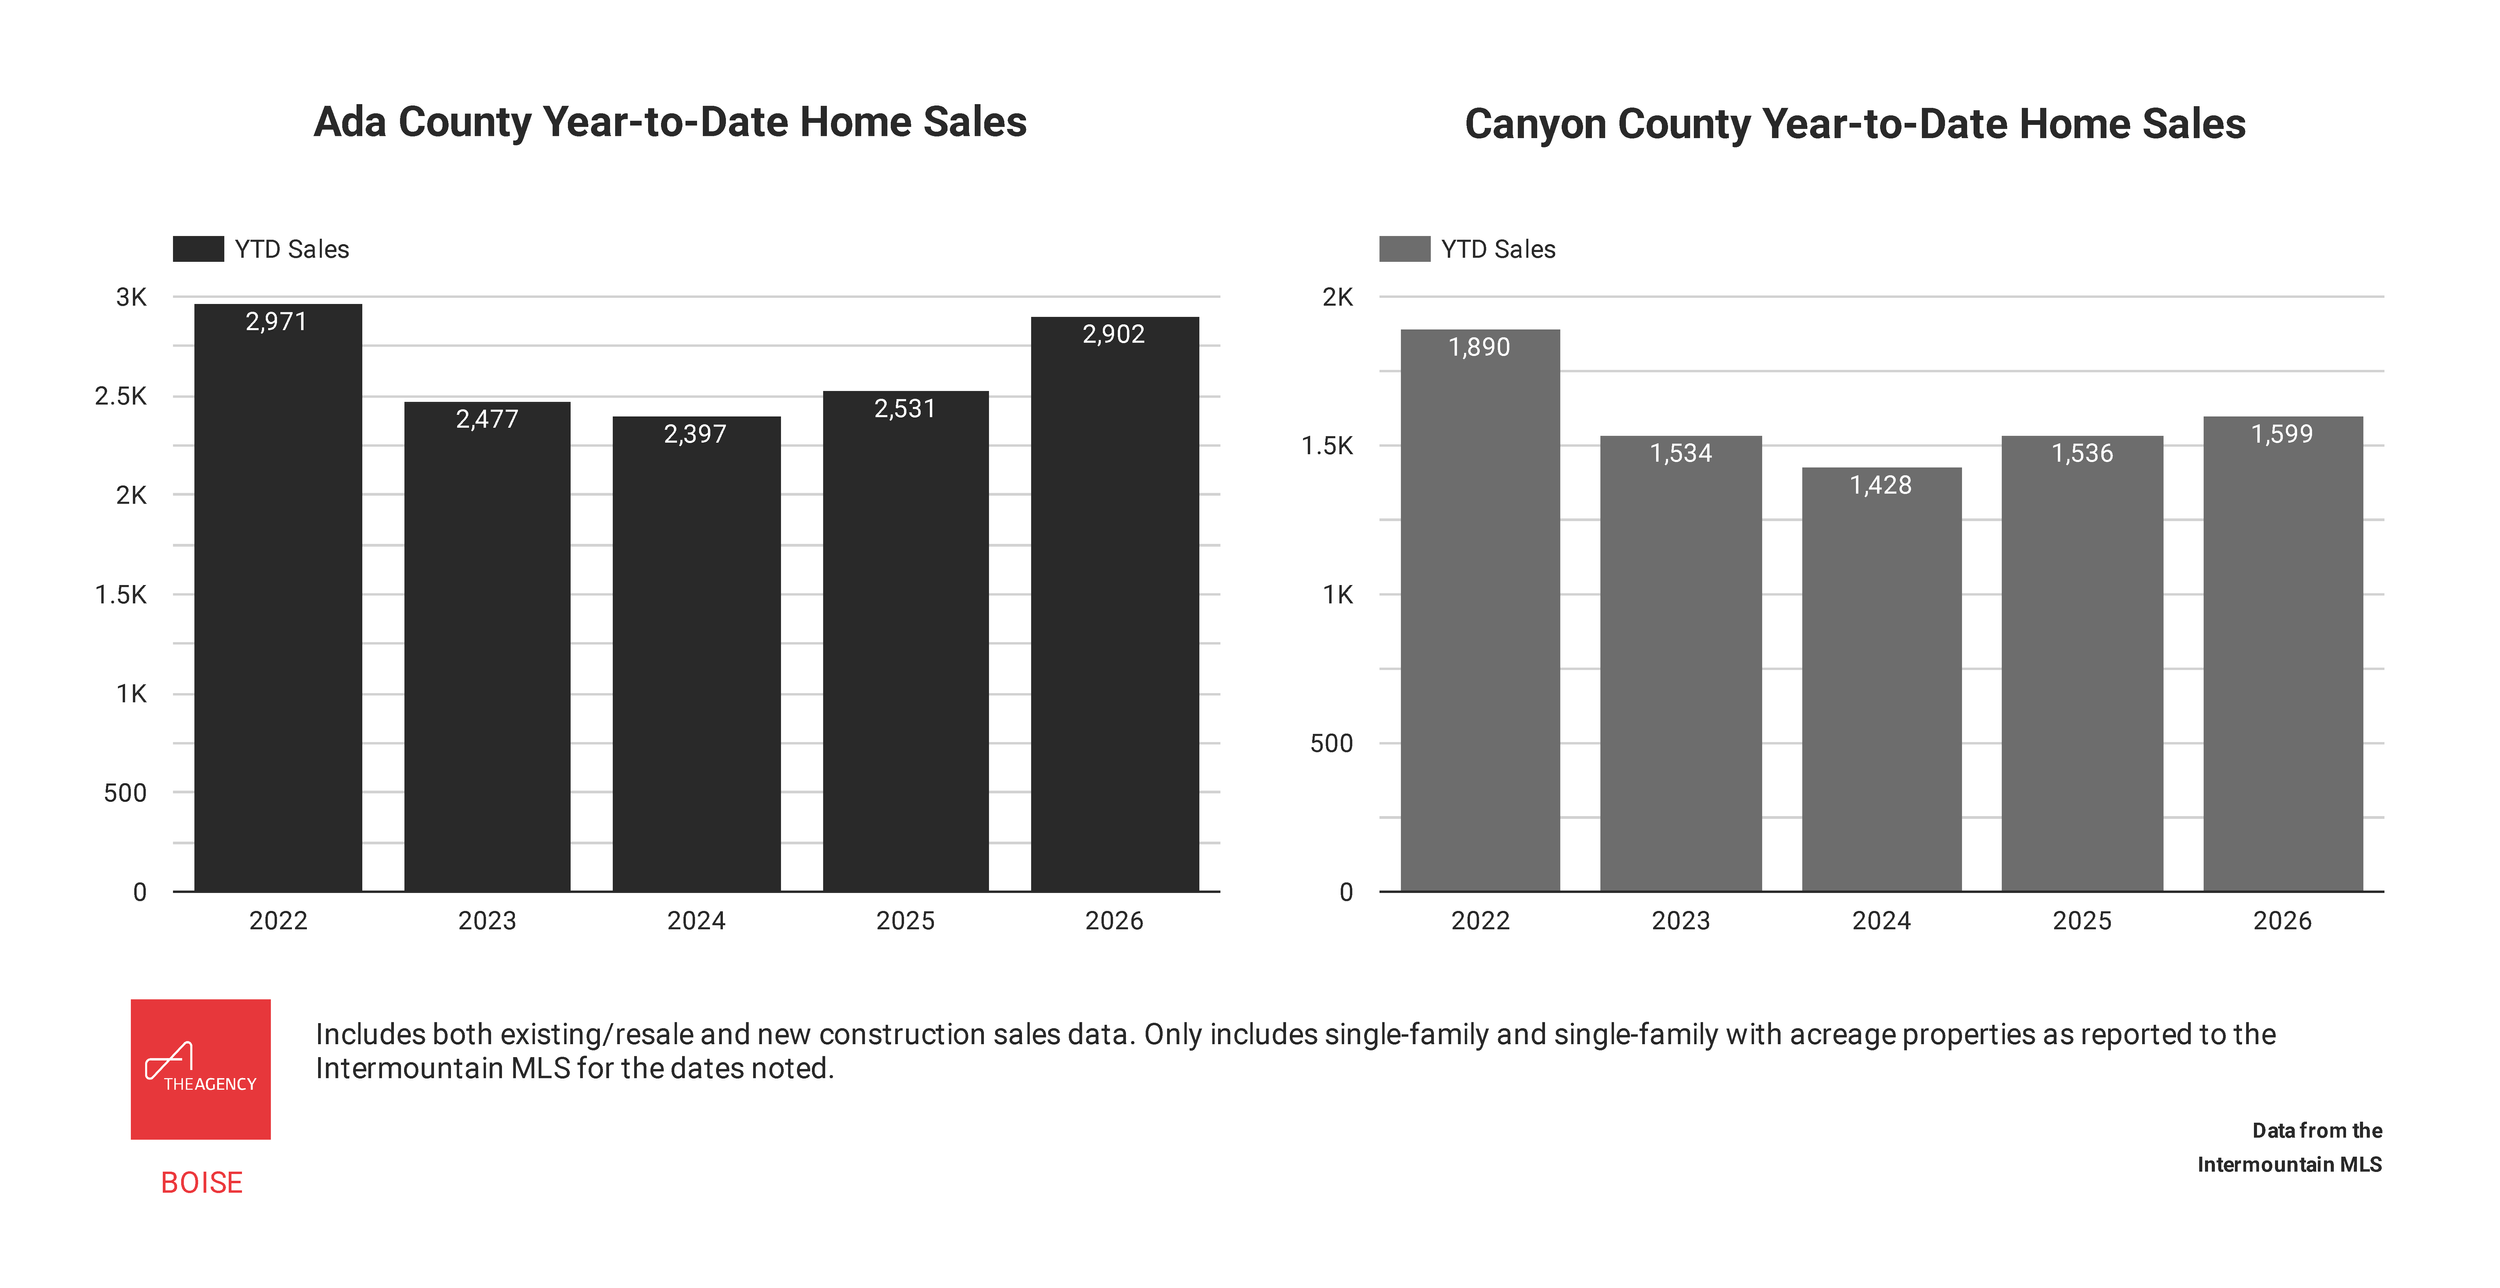
More homes sold in April in both Ada and Canyon County compared to the same month last year, with a notable 21.4% increase in Ada County and 3.3% in Canyon County. Year-to-date, there have been 2,902 closings in Ada County and 1,599 in Canyon County, a year-over-year increase of 14.7% and 4.1% respectively, and outperforming the first quarters of 2023-2025.
Sales were up, but inventory, or the number of available listings, was down year-over-year for the second consecutive month in Ada and the third consecutive month in Canyon County. Ada County buyers had 1,735 available homes to choose from in April — a 8.2% decrease or 155 fewer listings than in April 2025. With 1,022 active listings, Canyon County buyers had 113 fewer listings to choose from compared to a year ago, a 10.0% decrease.
As we’ve reported previously, the dip in inventory is significant as it broke the 24 consecutive month run of year-over-year gains in housing supply for both counties. In 2024 and 2025, both counties gained traction in accumulating inventory and moving the housing market to a more balanced level.
Months supply of inventory is the metric used to measure the relationship between supply and demand, calculated by dividing the current inventory by the average sales from the last 12 months and indicates how long current inventory would last if no new listings were added. A balanced market, not favoring buyers or sellers, is typically considered 4-6 months of supply. In Ada County, months supply of inventory was 2.2 months in April, down 15.7% compared to April 2025. Canyon County had 2.4 months last month, a 13.5% decrease from a year ago.
The low months supply of inventory indicates that we’re undersupplied, which is true, but this seller’s market is a bit more nuanced. Aimee Kane, real estate agent and associate broker with The Agency Boise, explains, “Mortgage interest rates and economic conditions are keeping buyers cautious, so while we are seeing an uptick in sales, we are not seeing the same surge in housing demand we would expect if rates were lower. Home sellers who make necessary improvements to the property, have a strong marketing strategy, and most importantly, price competitively, are seeing the most success in market times and net proceeds.”
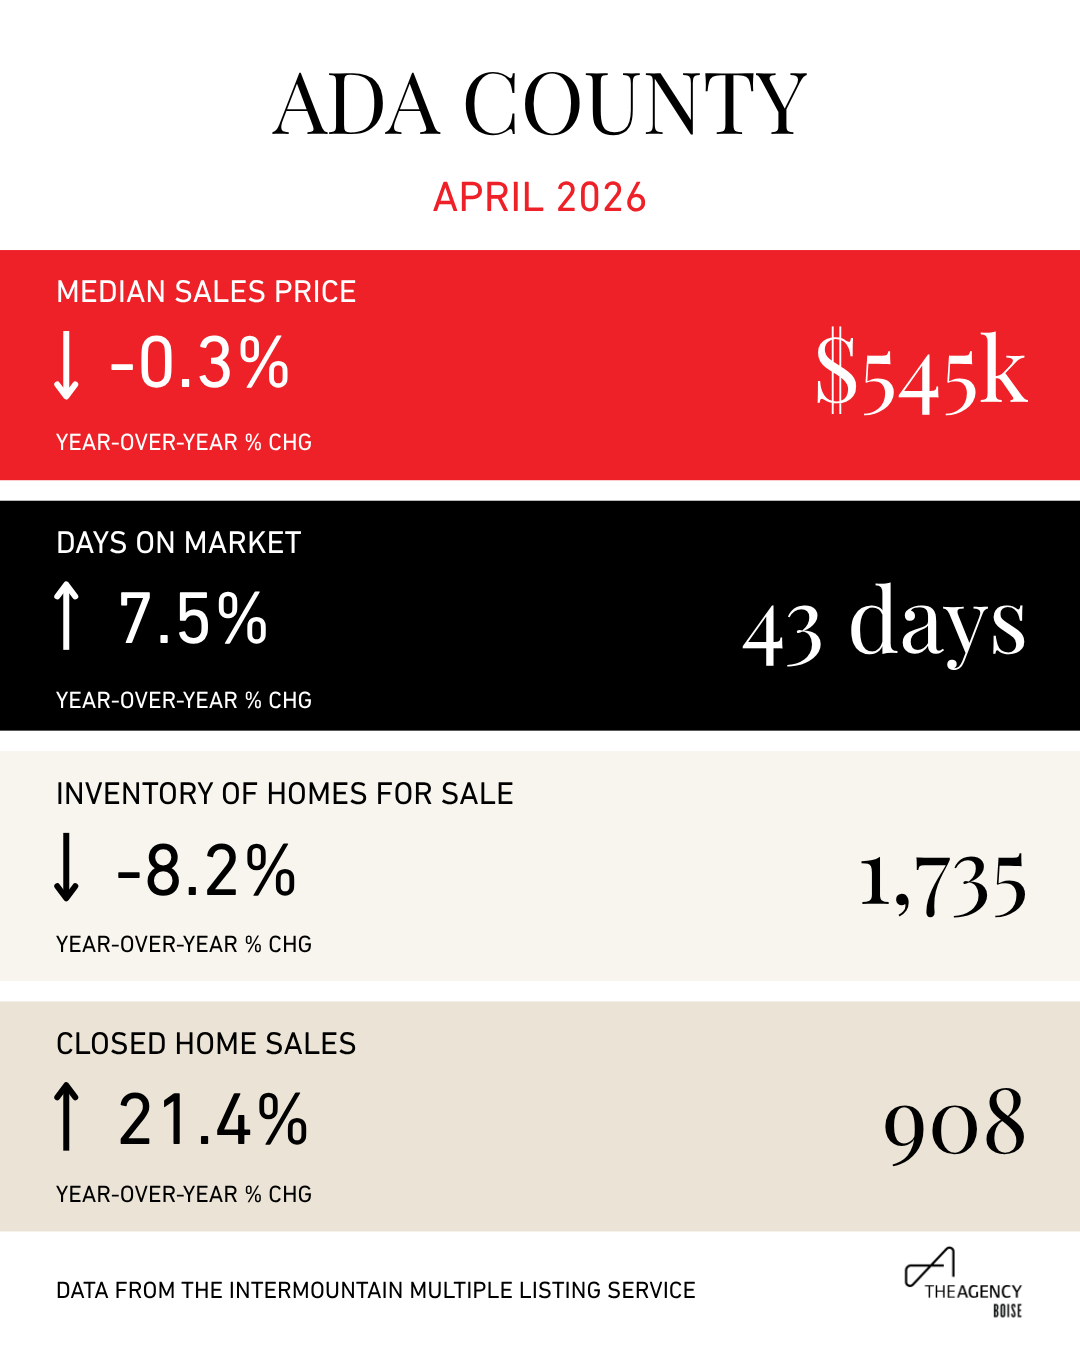
Ada County home prices remained relatively flat in April. The median sales price of homes that closed last month was $545,000, approximately $1,800 lower than in April 2025, less than a 1% decrease. For the second month in a row, the median sales price of existing/resale homes in Ada County was higher than new construction homes in April — $548,013 compared to $542,400, respectively. Typically, we see a higher premium for new homes compared to resale, but the share of new home sales with a lower median sales price pulled the overall median sales price down for the county for the last two months.
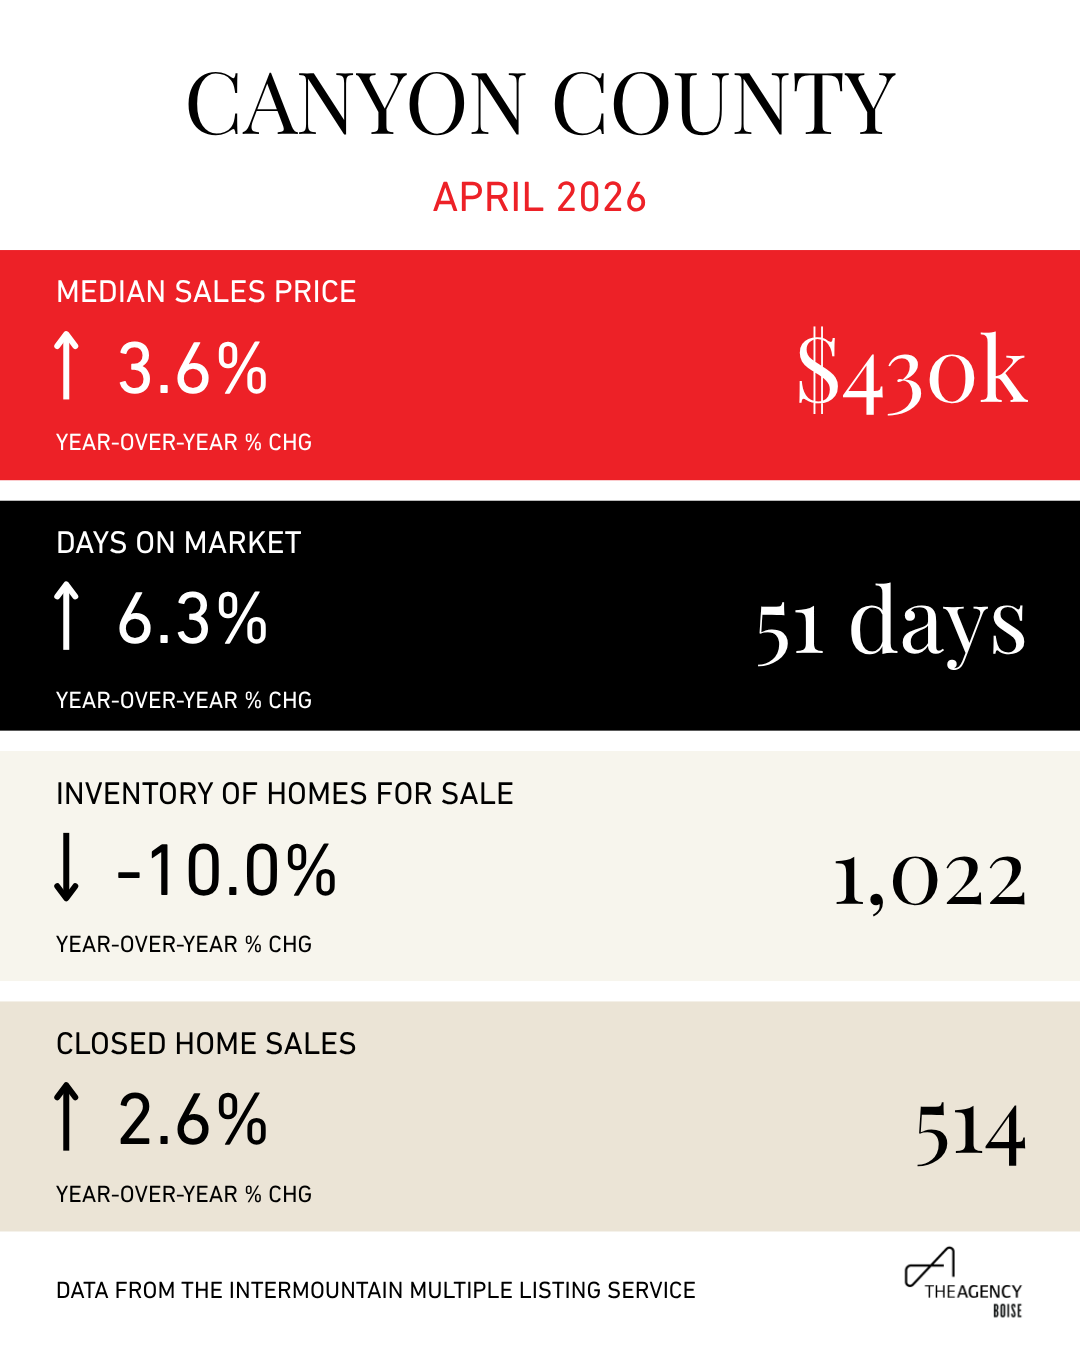
In Canyon County, the median sales price for home sales was $429,945 last month, nearly $15,000 more than in April 2025, a 3.6% increase.
Through price reductions and negotiations, over 60% of April buyers were able to purchase at a lower price than what the property was initially listed at. Homes sold for an average of 1.4-1.8% less than the original list price last month.
Whether you’re in the market to purchase a home or sell, who you work with matters. The Agency Boise is made up of a select group of driven agents that have deep roots in the community, local expertise, and are backed with a regional and global reach. Our professional agents can provide the expertise and guidance to help you reach your real estate goals.


Other notable metrics:
In Ada County,
Buyers had 1,735 available homes to choose from in April — 155 fewer than in April 2025.
There were 1,512 pending sales, or homes under contract, in April, up 12.7% compared to a year ago.
With 908 sales for the county, there were 160 more closings in April than the same month a year ago.
The median sales price for homes that closed last month was $545,000, approximately $1,800 less than in April 2025.
The average percent of the original list price received for homes that closed in April was 98.6%, meaning that on average, buyers paid 1.4% less than the price for which the home was originally listed.
Months supply of inventory was 2.2 months in April, down 15.7% compared to April 2025. Months supply is calculated by dividing the current inventory by the average sales from the last 12 months and indicates how long current inventory would last if no new listings were added. A balanced market, not favoring buyers or sellers, is typically considered 4-6 months of supply.
The most popular price range for home sales was $450,000-$600,000 with 297 sales — approximately a third of all sales for the county. Of those, the average days on market before going under contract was 48 days and the average percent of original list price received was 98.0%.
As of May 8, 2026, the list price range with the most inventory was $450,000-$600,000 with 460 listed homes. Of those, the average days they’ve spent on the market so far is 46 days. Those listed homes have undergone an average of a 1.0% price drop from the original listing price.
In Canyon County,
With 1,022 active listings in April, inventory was down 10.0% year-over-year, giving buyers 113 fewer listings to choose from compared to a year ago. New homes made up over half of all available homes for sale.
There were 853 pending sales in April 2025, up 3.3% when compared to the same month a year ago.
With 514 sales last month, closings were up 2.6% compared to April 2025.
The median sales price for April home sales was $429,945, nearly $15,000 more than in April 2025.
The average percent of the original list price received for homes that closed in April was 98.2%, meaning that on average, buyers paid 1.8% less than the price for which the home was originally listed.
Months supply of inventory was at 2.4 months in April, down 13.5% from the same month last year. Months supply is calculated by dividing the current inventory by the average sales from the last 12 months and indicates how long current inventory would last if no new listings were added. A balanced market, not favoring buyers or sellers, is typically considered 4-6 months of supply.
The most popular price range for home sales was $300,000-$450,000 with 279 sales, over half of all home sales for the county. Of those, the average days on market before going under contract was 57 days and the average percent of original list price received was 98.0%.
As of May 8, 2026, the list price range with the most inventory was $450,000-$600,000 with 363 listed homes. Of those, the average days they’ve spent on the market so far is 53 days. Those listed homes have undergone an average of a 1.0% price drop from the original listing price.

Ready for more insights?
The Agency Boise provides detailed monthly analysis, interactive reports, and custom market research for our agents.